
Microsoft Fabric and Power BI
Bring Arc data into Microsoft Fabric with a notebook that reads Arc's Arrow query endpoint, write it to a Lakehouse table, and build a Power BI report on it, all in the browser.
Get Arc data into a Power BI report in Microsoft Fabric, entirely in the browser: no Power BI Desktop, no Windows machine, no gateway and nothing to install on Arc.
A Fabric notebook queries Arc's HTTP API, receives the result as Arrow, and writes it to a Lakehouse table. Power BI reads that table directly (Direct Lake), and a schedule keeps it current.
Arc  ──POST /api/v1/query/arrow──▶  Fabric notebook  ──▶  Lakehouse table  ──▶  Semantic model  ──▶  Power BI report
       (Arrow, over HTTPS)          (scheduled)          (Delta, OneLake)      (Direct Lake)
Works with the Arc you run today
The Arrow endpoint used here is in every Arc release since v25.12.1. For older releases, use the JSON variant below.
Before you start
- A Fabric workspace on a trial or Fabric capacity. Notebooks and Lakehouses are not available on a Power BI Pro–only workspace.
- Arc reachable from the internet over HTTPS. The notebook runs in Microsoft's cloud, so it cannot reach an Arc on your laptop or private network.
- A read-only Arc token, limited to the databases the report needs. Never use an admin token here.
The steps use the demo dataset weather_tracking.weather_observations (three cities, a reading every few minutes). Replace it with your own database and measurement.
1. Create a workspace
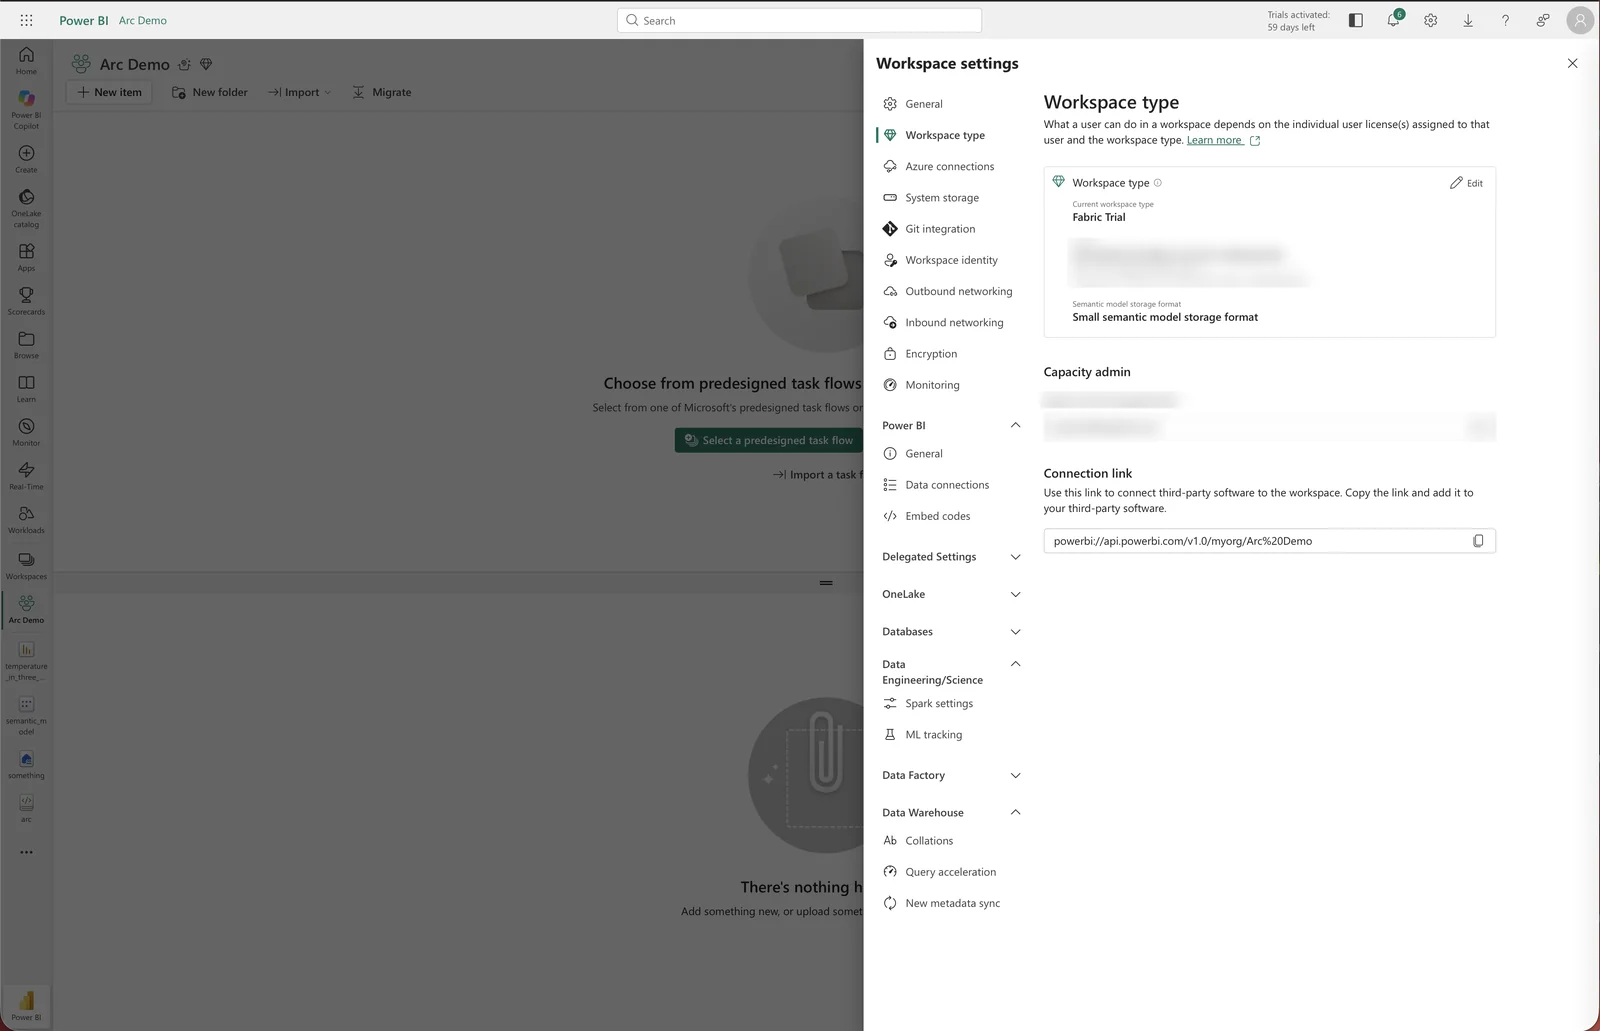
In app.fabric.microsoft.com, open Workspaces → New workspace, name it, and under Advanced choose Trial (or a Fabric capacity) as the license mode. You can check the mode later under Workspace settings → Workspace type:
2. Create a Lakehouse
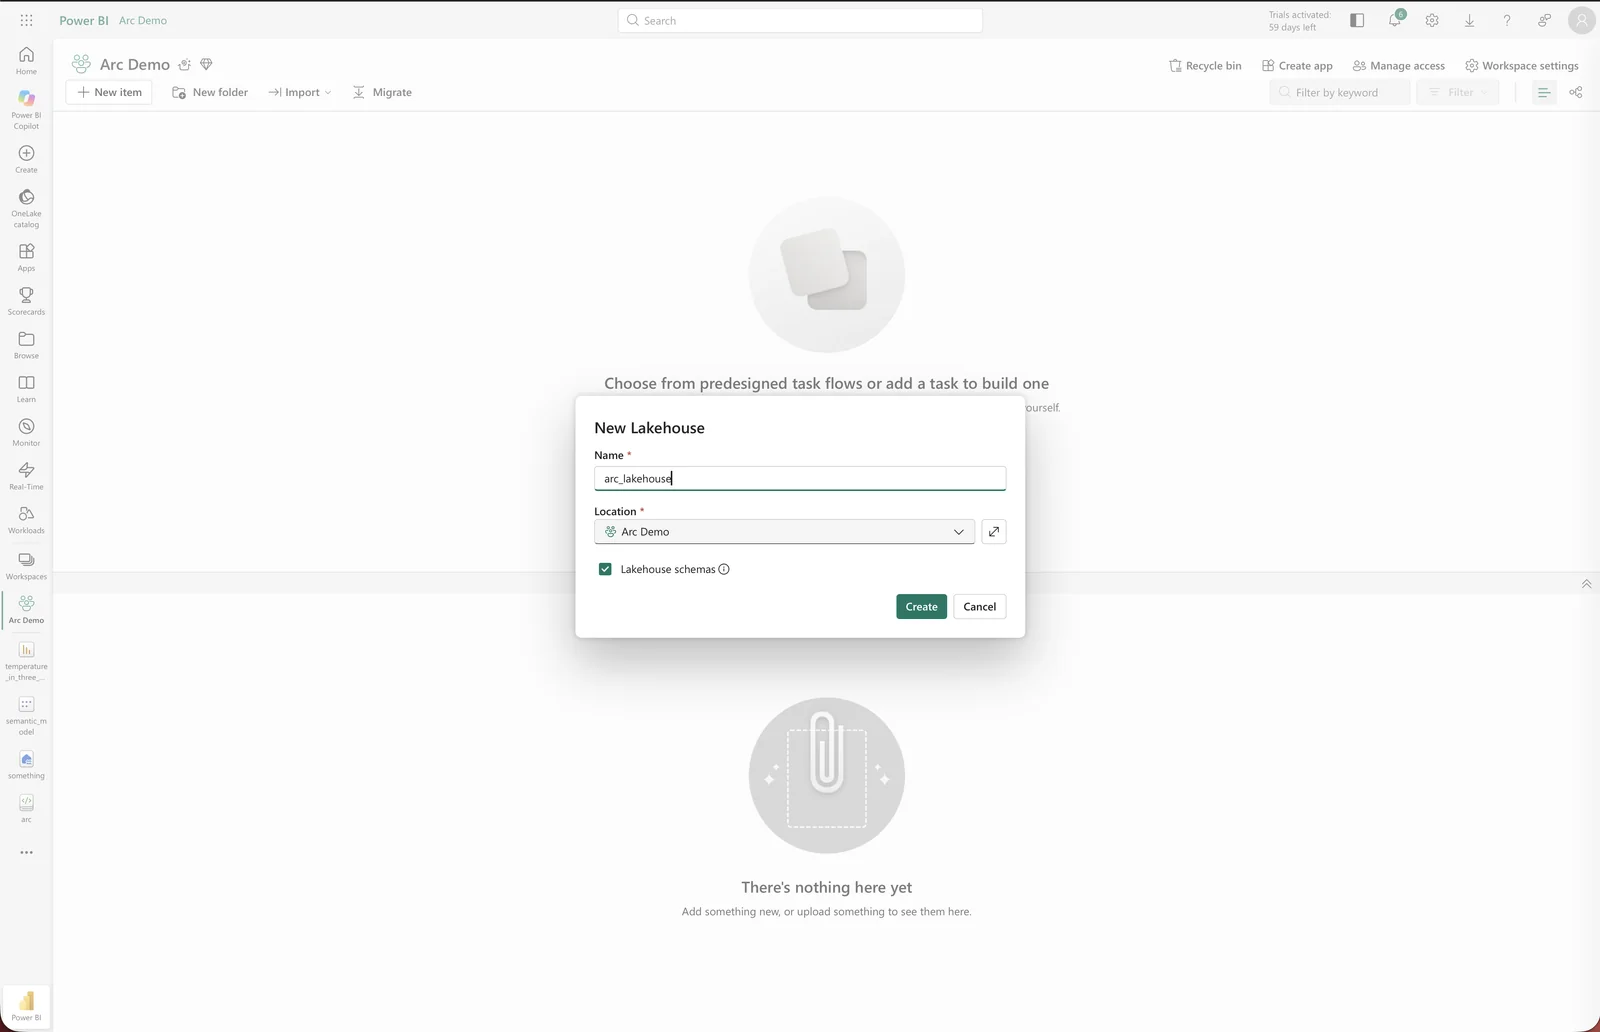
In the workspace, click New item → Lakehouse, name it arc_lakehouse and click Create:
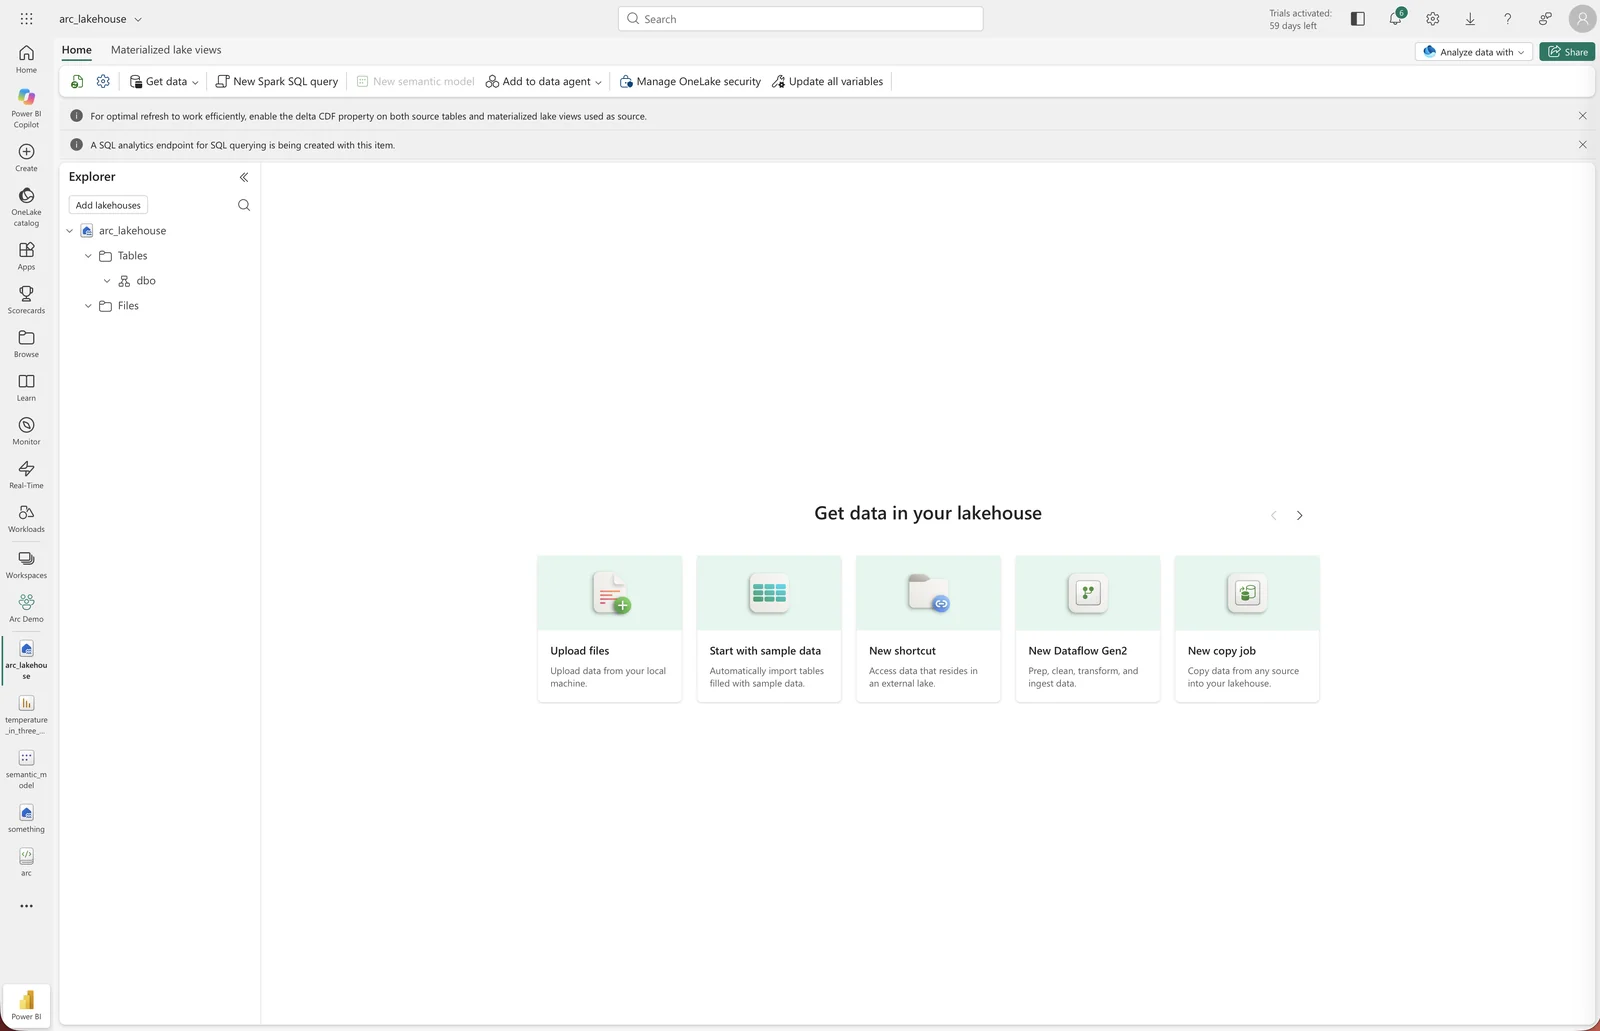
The Lakehouse opens empty. With Lakehouse schemas on (the default), tables go in the dbo schema. New semantic model stays greyed out until the Lakehouse has a table:
3. Create a notebook
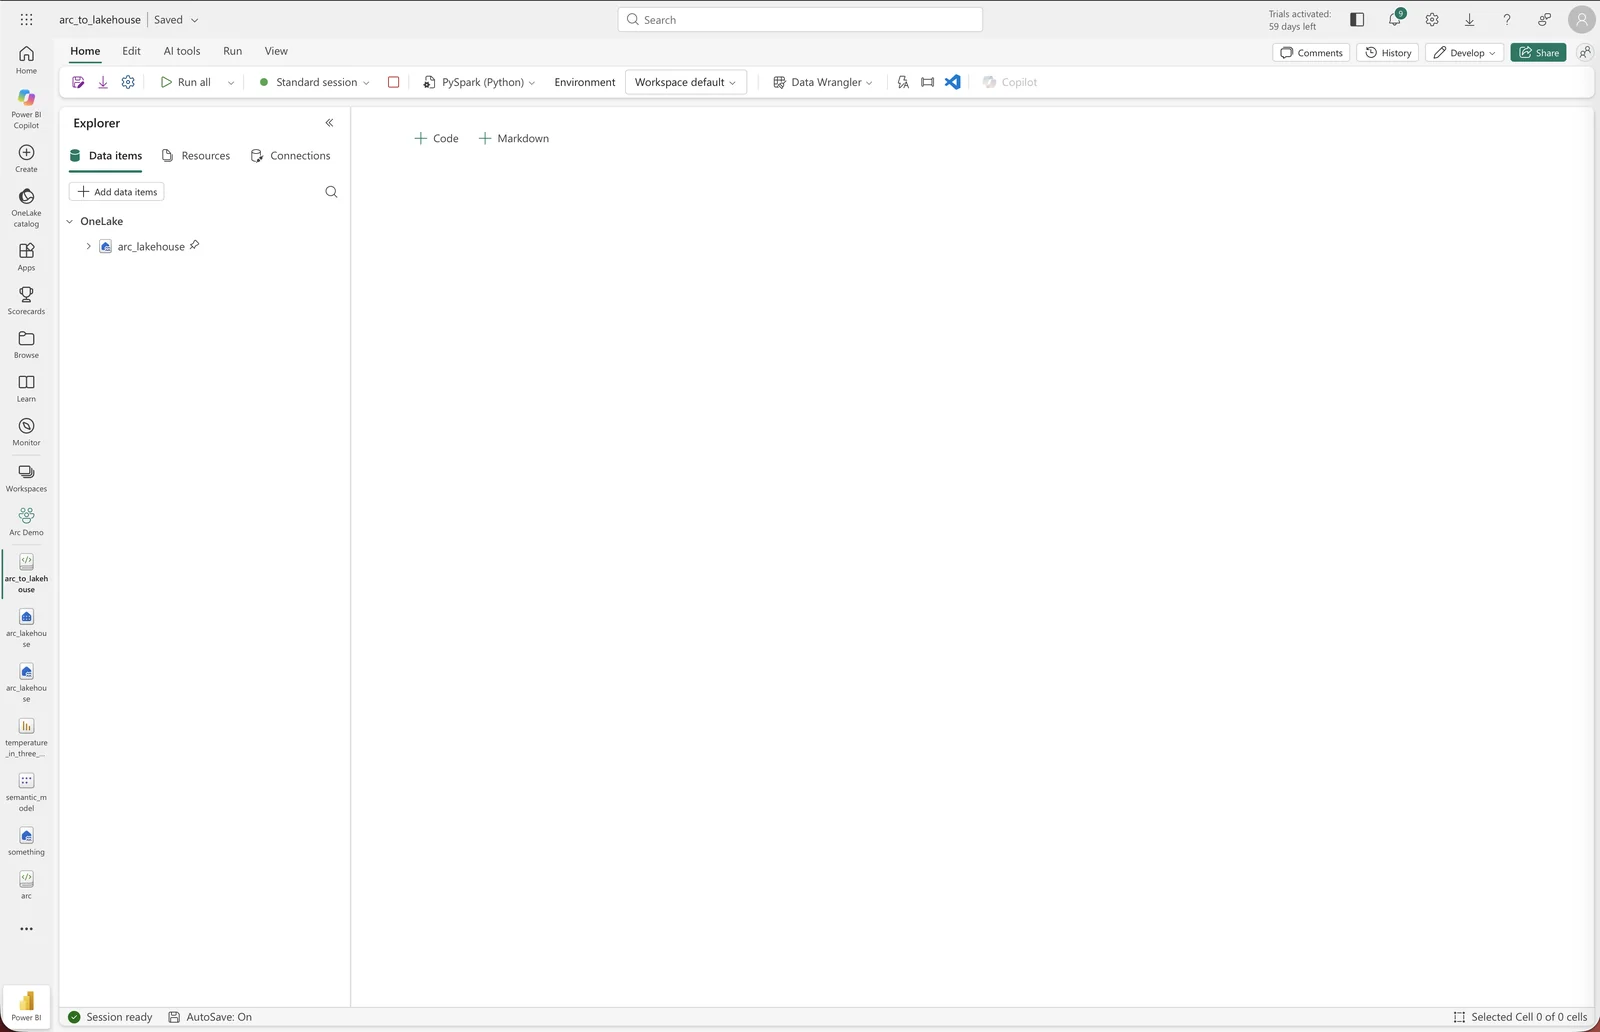
From the workspace, click New item → Notebook, then attach the Lakehouse in the notebook's Explorer with Add data items. (Opening the notebook from the Lakehouse attaches it for you.) Rename it arc_to_lakehouse:
4. Pull data from Arc
Use two cells, so the token is never visible in the code you share or screenshot.
Cell 1, the token. Collapse it afterwards (⋯ → Hide input):
ARC_TOKEN = "<a read-only Arc token>"Cell 2, the query:
import requests, pyarrow.ipc as ipc

ARC_URL = "https://arc.example.com"
SQL = """
SELECT * FROM weather_tracking.weather_observations
WHERE time > now() - INTERVAL 30 DAY
"""

r = requests.post(f"{ARC_URL}/api/v1/query/arrow",
                  headers={"Authorization": f"Bearer {ARC_TOKEN}"},
                  json={"sql": SQL}, stream=True, timeout=300)
r.raise_for_status()
table = ipc.open_stream(r.raw).read_all()   # Arrow: columnar, exact types
print(f"{table.num_rows} rows from Arc")

spark.createDataFrame(table.to_pandas()) \
     .write.mode("overwrite").saveAsTable("weather_observations")
Click Run all. The cell prints the row count and writes the table:
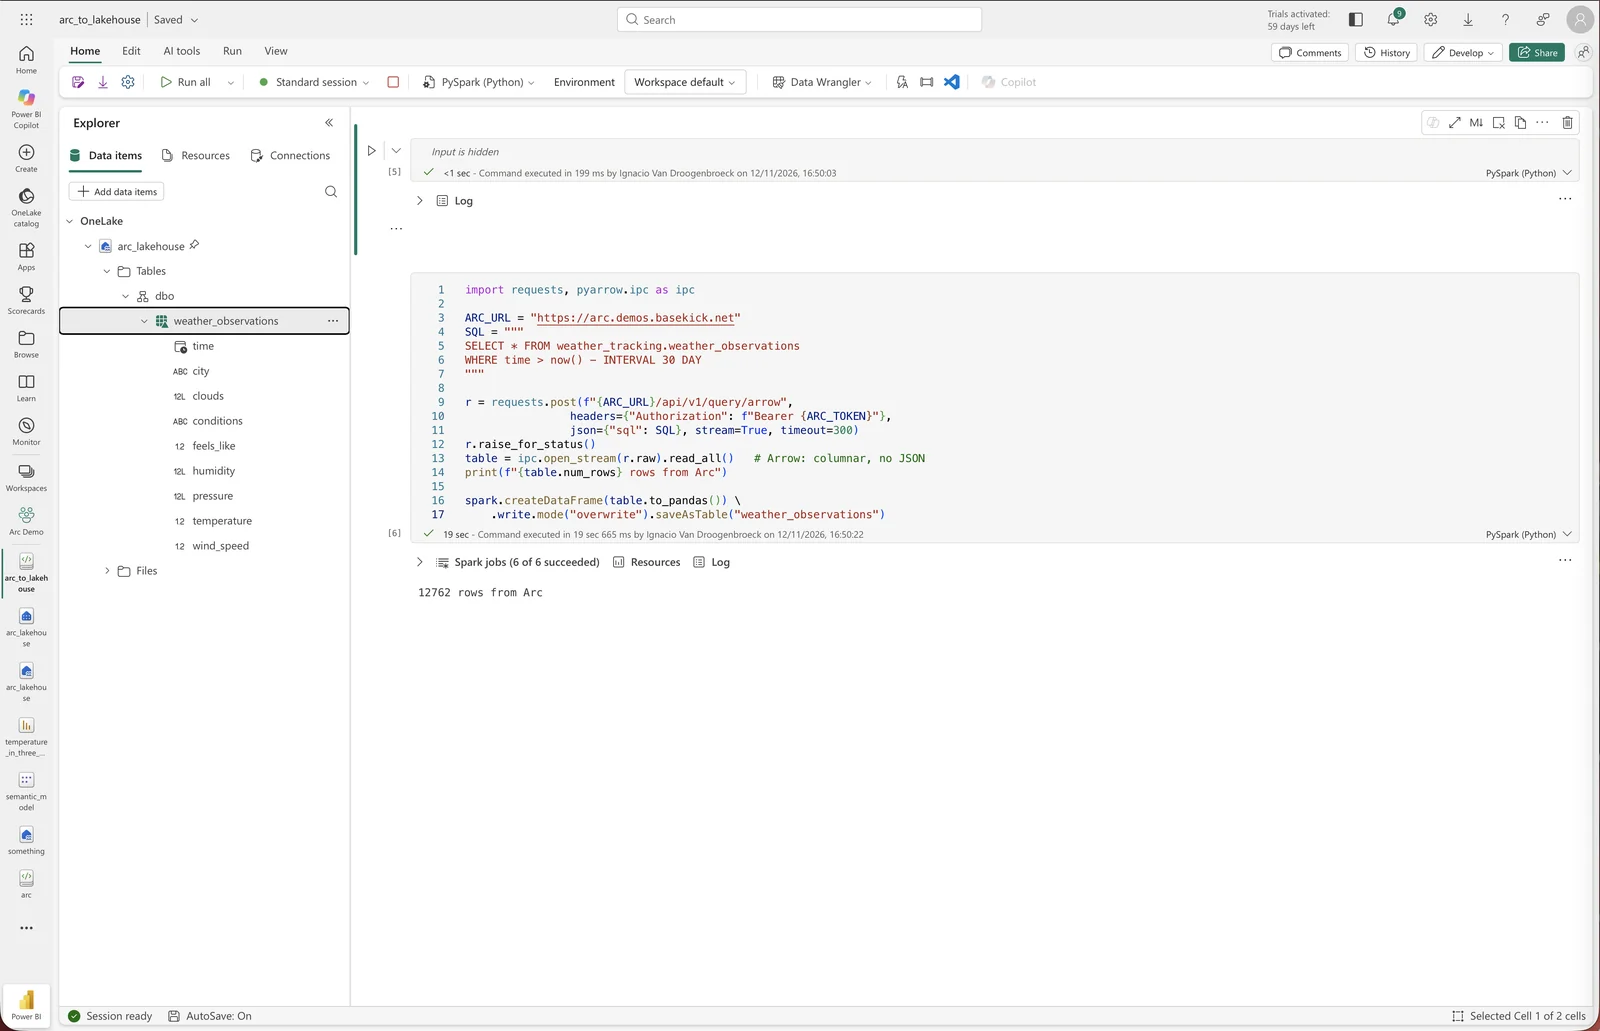
Refresh the Explorer
The new table appears in the Explorer only after a refresh: dbo → ⋯ → Refresh.
The WHERE time > now() - INTERVAL 30 DAY filter keeps each run bounded: the whole result passes through the notebook's memory, so pull the window the report needs rather than the whole measurement. Any SQL Arc accepts works here, including aggregations, so you can also ship pre-aggregated data (for example hourly averages) instead of raw rows.
5. Create the semantic model
Back in the Lakehouse, click New semantic model, name it, and select dbo → weather_observations:
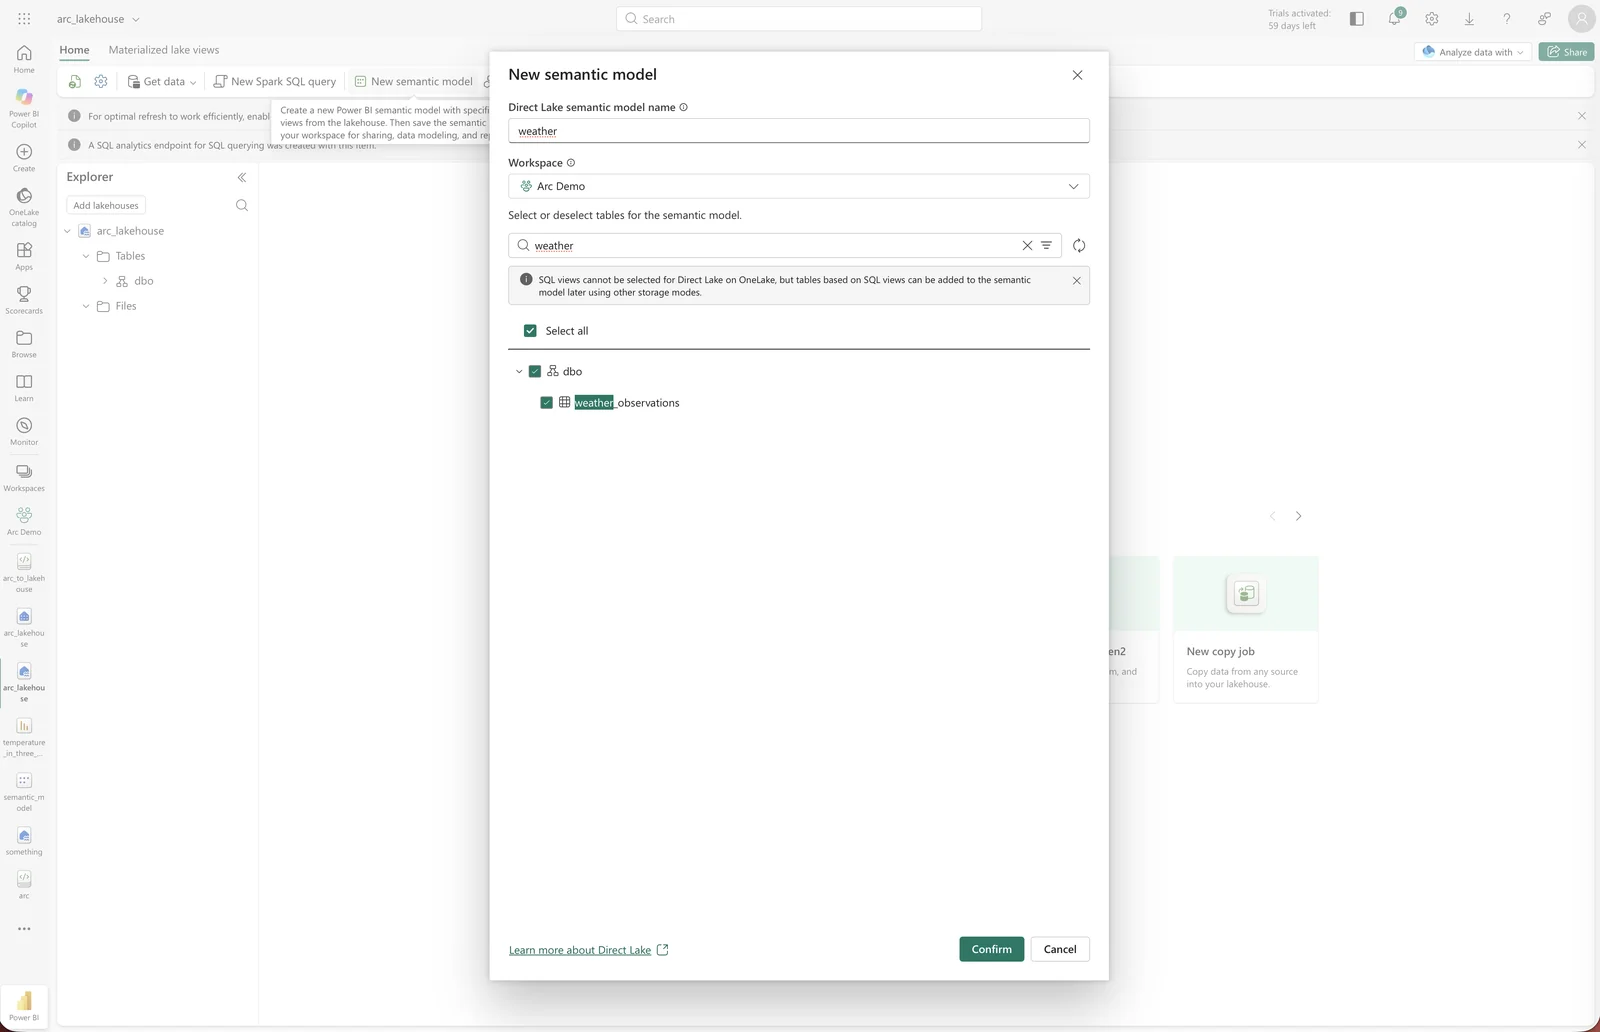
The model uses Direct Lake: Power BI reads the table's files in OneLake directly, with no import step.
6. Build the report
From the semantic model, create a new report. For a temperature chart per city:
- Line chart:
timeon the X-axis,temperatureon the Y-axis,cityin the Legend. - Set the Y-axis field to Average. Power BI defaults numeric fields to Sum, which adds up readings that share a timestamp.
- Filter by city in the Filters pane, or add a Slicer on
city.
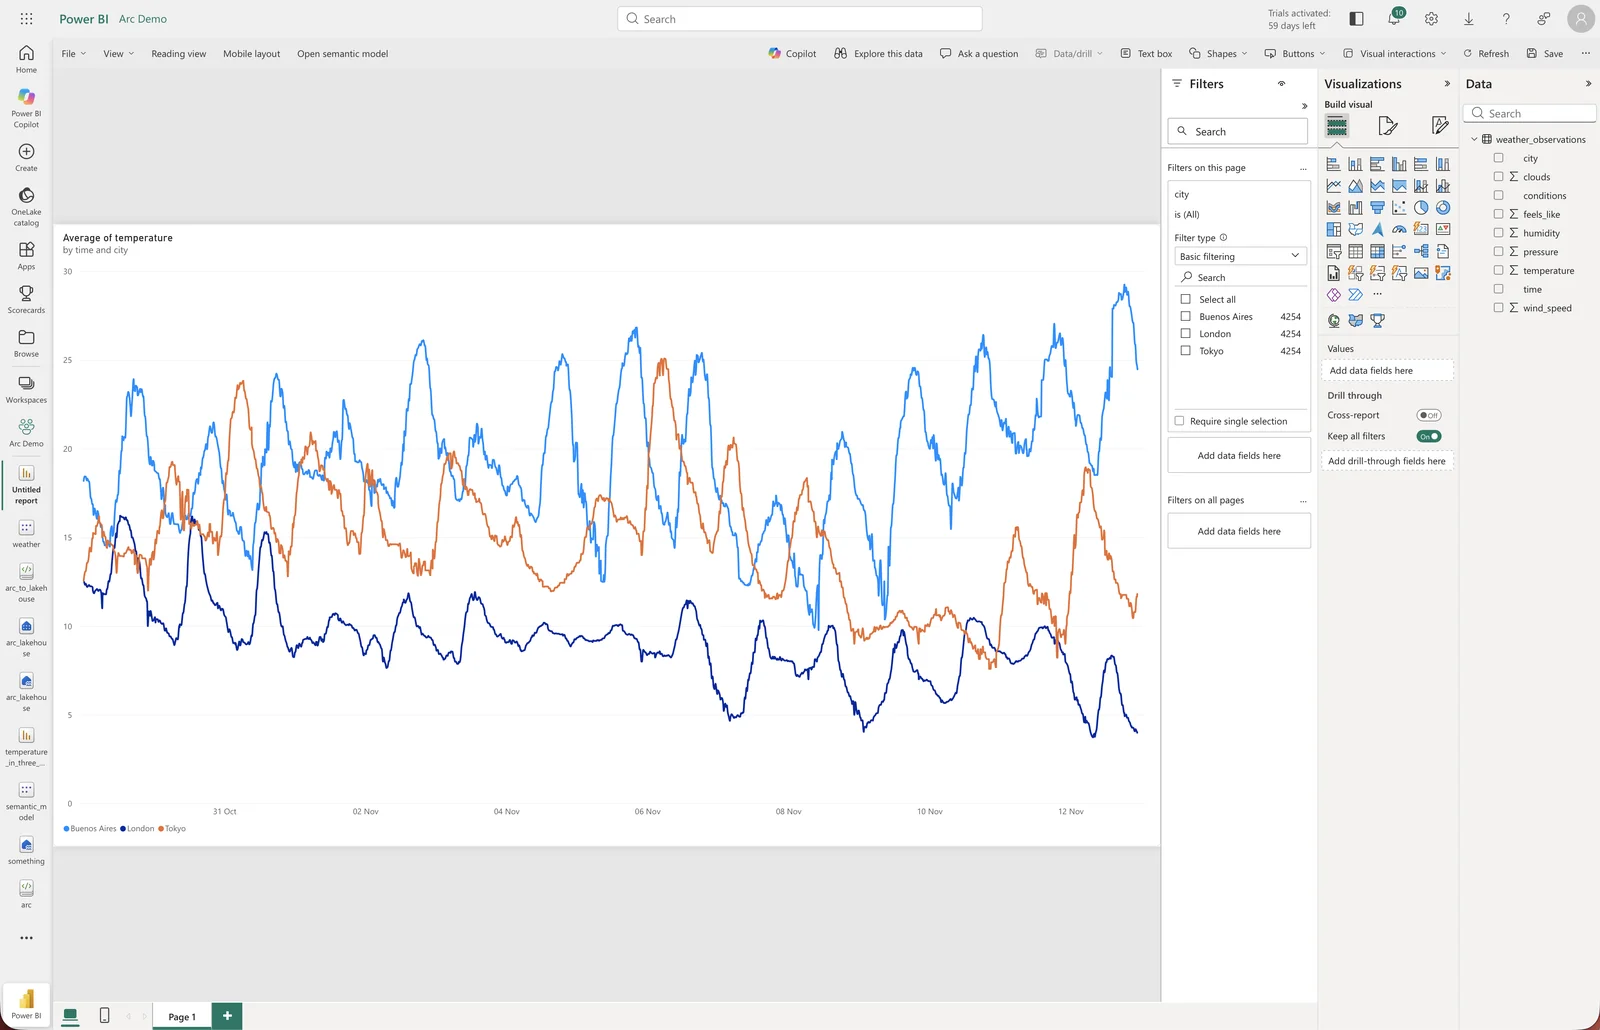
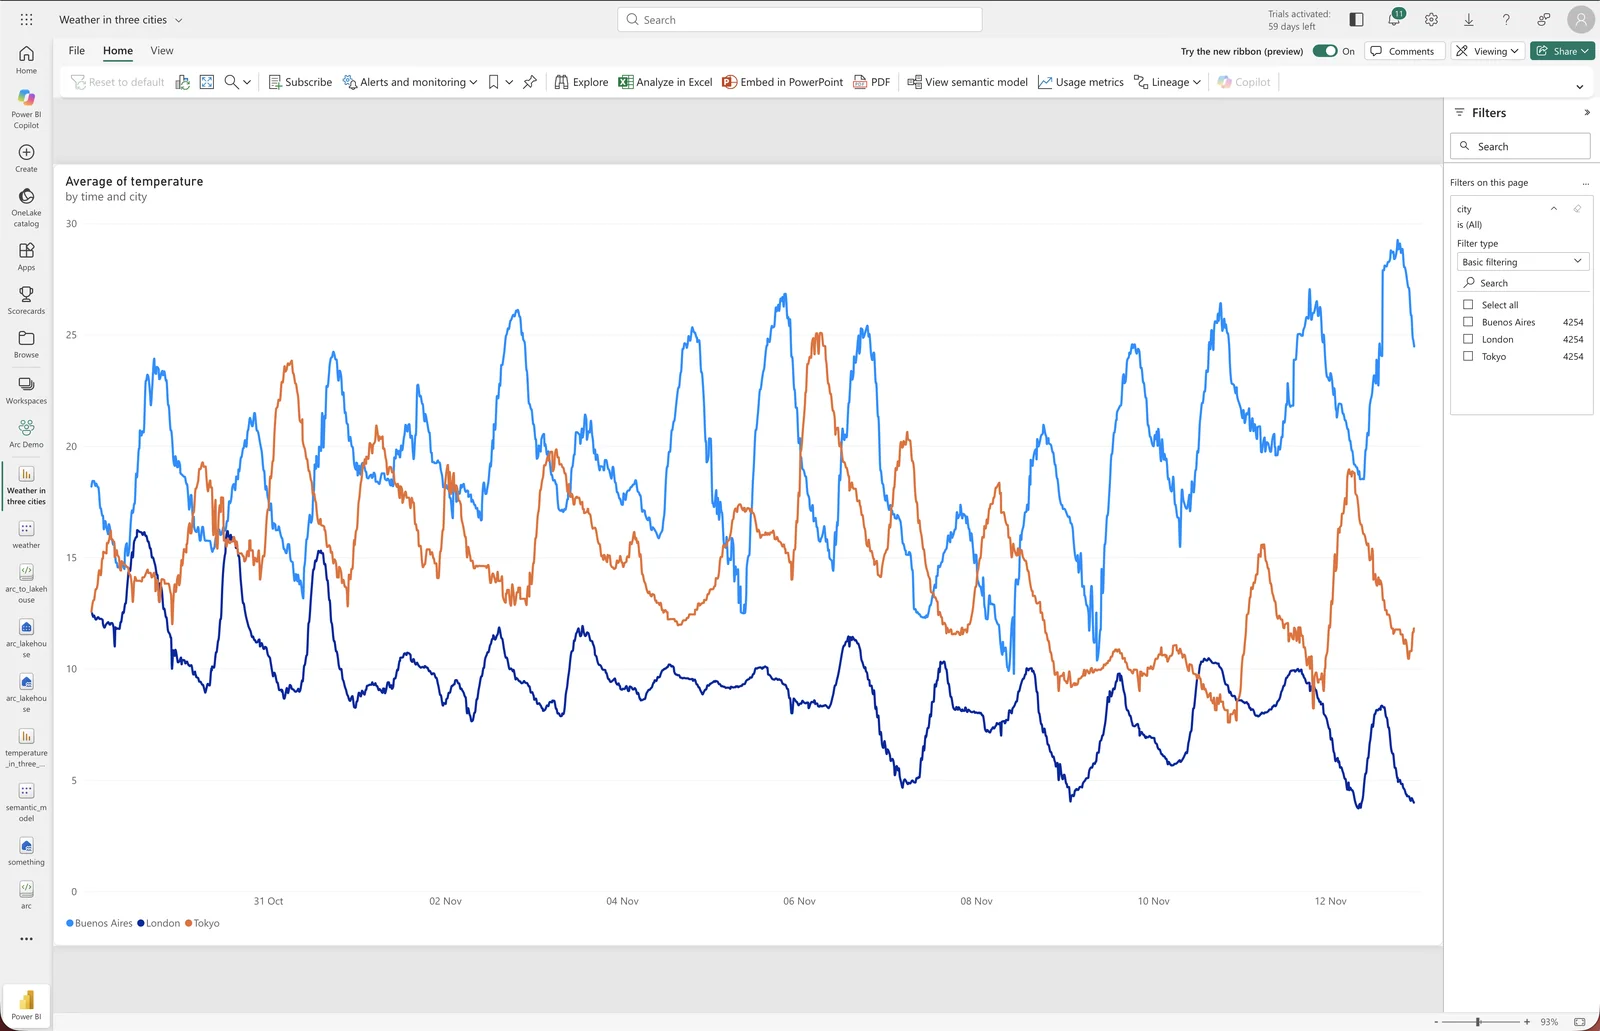
Save the report. In reading view:
7. Schedule the refresh
In the notebook, open Settings (⚙) → Schedule → Add schedule, choose Hourly with an interval of 1, and Save:
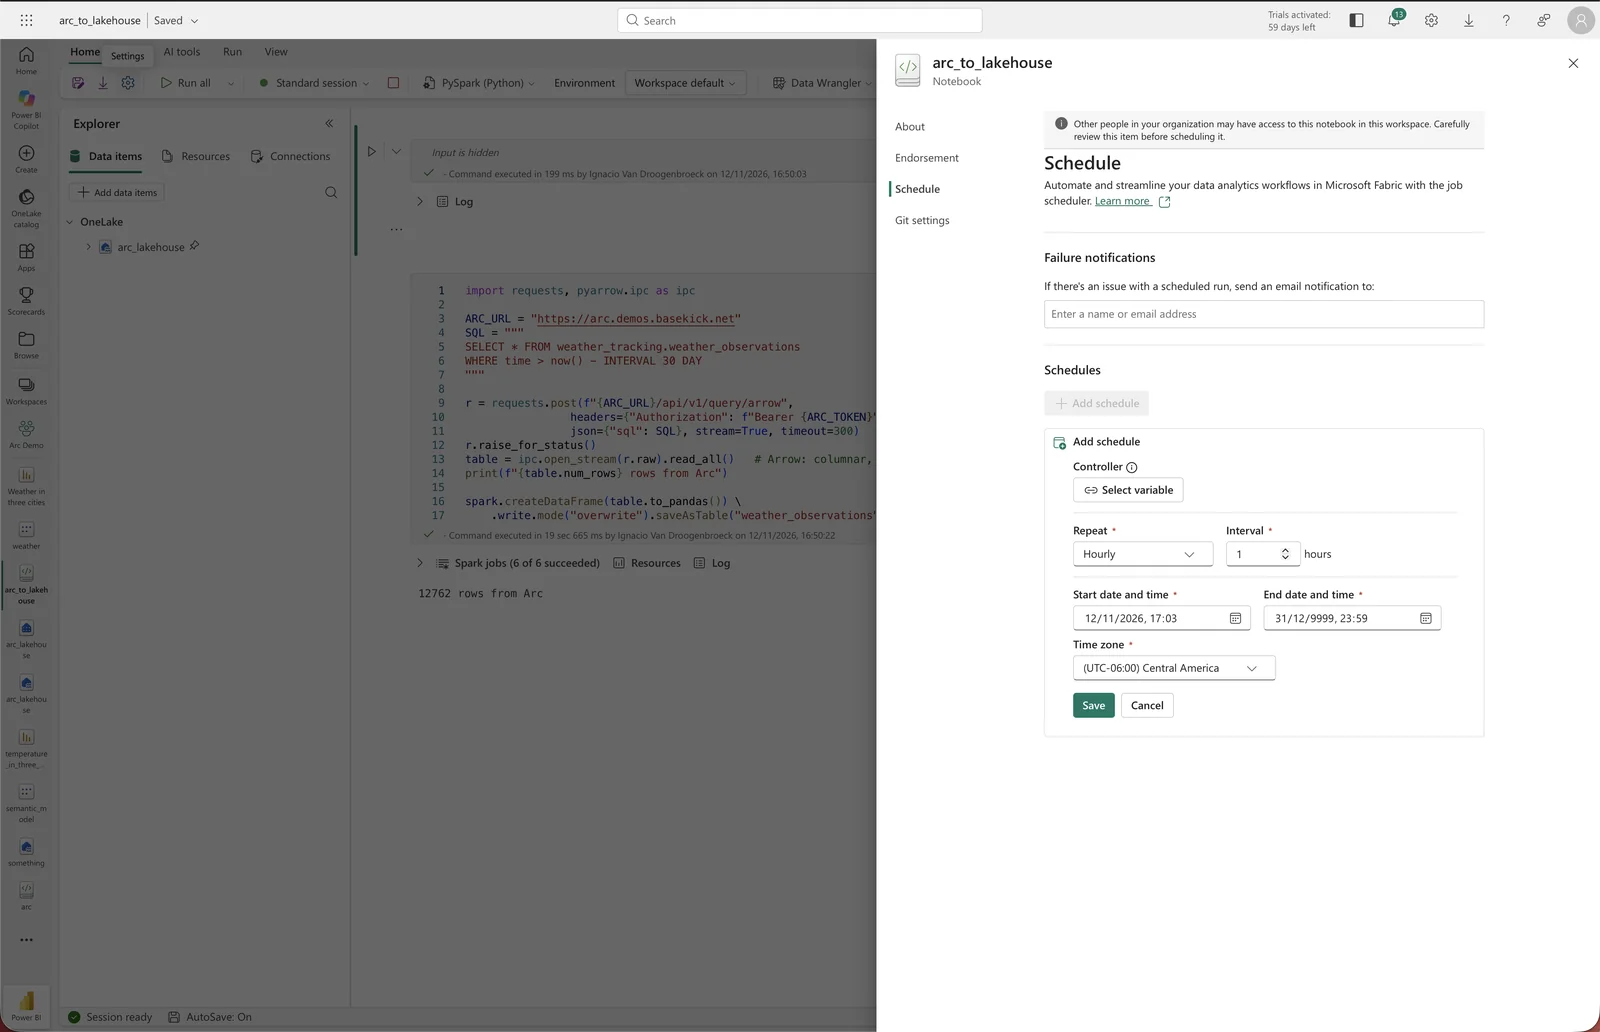
Each run replaces the table with the latest window from Arc. An open report does not pick up the new data on its own: click Refresh in the report to see it.
Older Arc releases (JSON)
Releases before v25.12.1 have no Arrow endpoint. Use the JSON one instead. JSON carries no column types, so convert the time column and check numeric types yourself: a float column whose values happen to be whole numbers comes back as integers.
import requests, pandas as pd

r = requests.post(f"{ARC_URL}/api/v1/query",
                  headers={"Authorization": f"Bearer {ARC_TOKEN}"},
                  json={"sql": SQL}, timeout=300)
r.raise_for_status()
res = r.json()
pdf = pd.DataFrame(res["data"], columns=res["columns"])
pdf["time"] = pd.to_datetime(pdf["time"])

spark.createDataFrame(pdf).write.mode("overwrite").saveAsTable("weather_observations")
Production notes
- Keep the token out of the notebook. For anything beyond a trial, store it in Azure Key Vault and read it at run time with
notebookutils.credentials.getSecret("https://<vault>.vault.azure.net/", "<secret-name>"). - Least privilege. The notebook's queries go through RBAC like any other: give the token read access to the databases (or measurements) the report uses, nothing more. Every run is recorded in the audit log when audit logging is on.
- Governance row caps. If the token has a governance policy with a row cap, a query that hits it returns the rows up to the cap, and Arc signals it in the
Arc-Rows-CappedHTTP trailer, which this notebook does not read. Make sure the cap is above the window you pull, or the table will be silently incomplete. - Size the window. Each run moves the whole query result. Bound it by time, or aggregate in SQL, to keep runs fast.
- Failure alerts. The schedule panel can email you when a scheduled run fails.
What's next
- Arrow Flight SQL (Arc 27.01.1). Arc gains a native Flight SQL listener for ADBC clients. Power BI ships a Flight SQL ADBC driver, which opens the way to a direct connector.
- Iceberg on object storage. If Arc stores its data in a bucket, its Iceberg export publishes tables any lakehouse engine can read, without copying data through a notebook.
Arrow Flight SQL
Query Arc Enterprise over Arrow Flight SQL with ADBC clients: enable the flight_sql listener, connect with a token, and how governance, audit and clustering apply to Flight queries.
Apache Superset Integration
Connect Apache Superset to Arc Enterprise with the arc:// SQLAlchemy dialect, pointing the connection string at a cluster endpoint with an RBAC-scoped read token.