
Logs & monitoring
Two console tabs with different jobs: Log Viewer reads the log data you ingest into Arc, with pattern detection and trace extraction; Monitoring reports Arc's own instance health.
Two console tabs cover observability, but they observe different things. Log Viewer is for the logs you store in Arc. Monitoring is Arc's own self-observability.
Log viewer
The Log Viewer tab reads the log data you've ingested into Arc: application logs, structured events, anything you write to a log measurement. Point it at your log tables and slice through them without writing the SQL by hand.
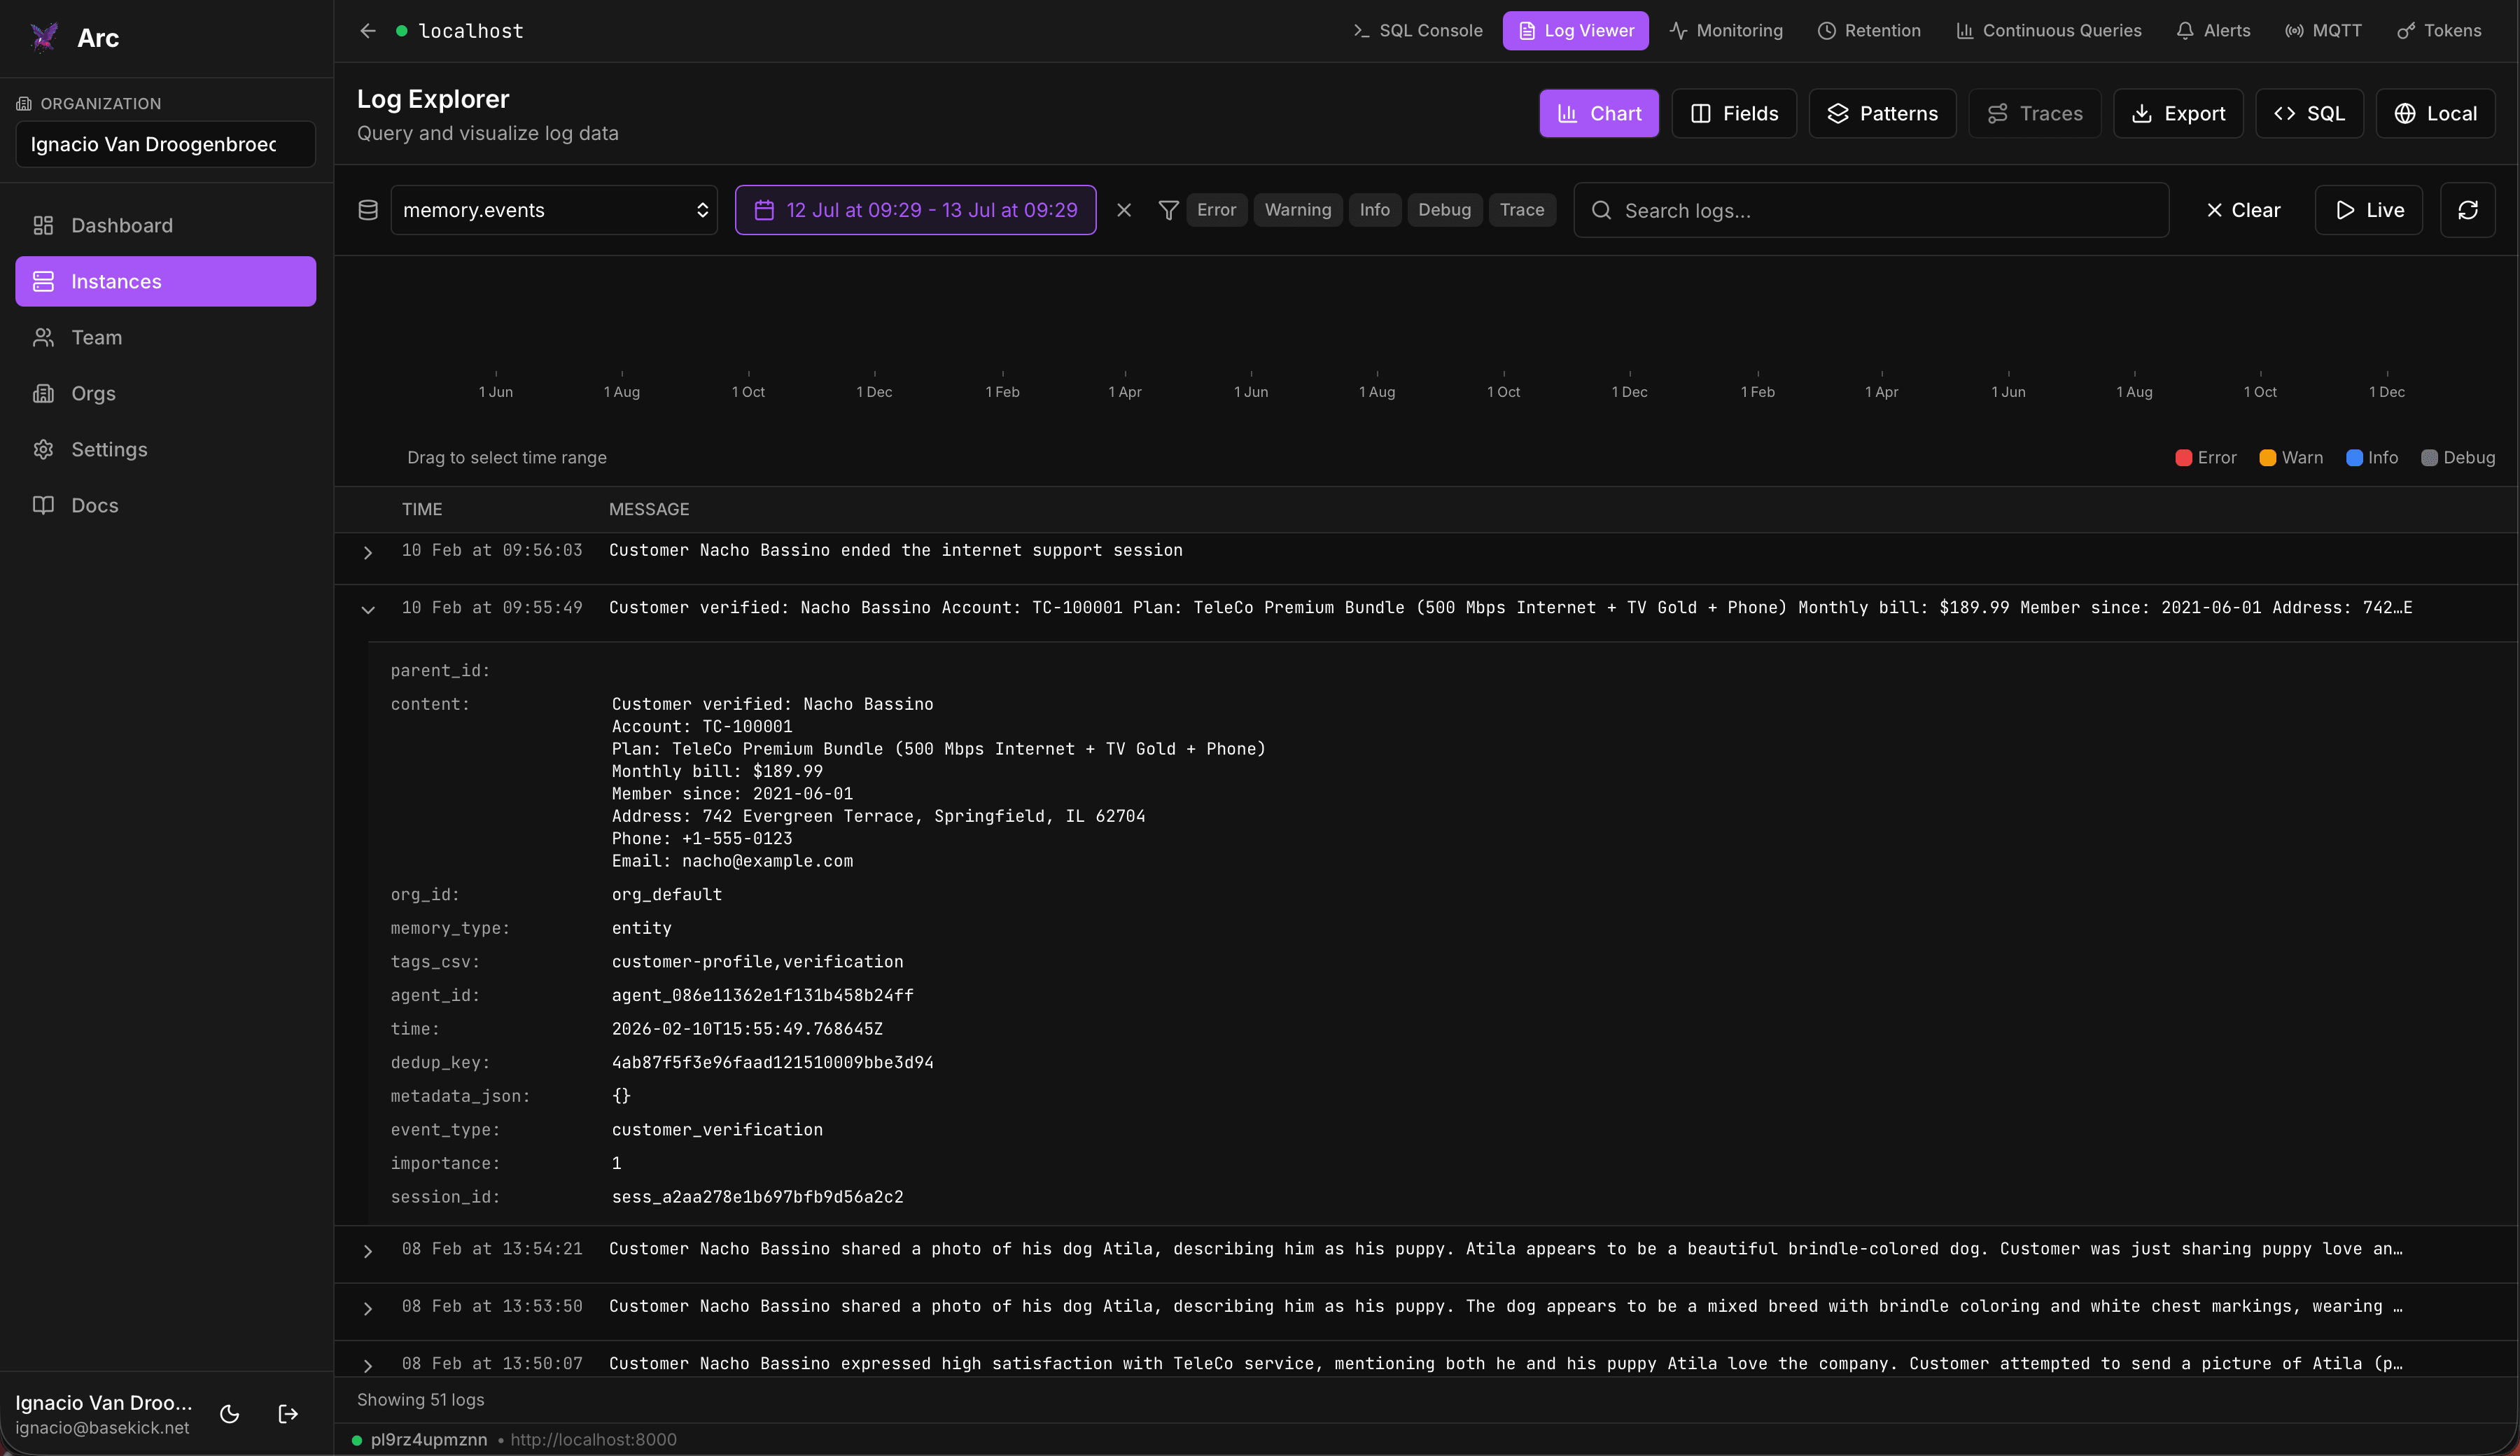
It adds tooling on top of the raw rows:
- Patterns: groups recurring shapes across your log lines so you can spot what's noisy. It needs a detectable message field, and is unavailable without one.
- Traces: pulls the entries belonging to one trace together and renders them as a waterfall, for following a request across services. It needs a
trace_idfield.
This is the right tab when you need to see what your application is doing, as recorded in Arc.
Monitoring
The Monitoring tab is Arc's own self-observability: how the instance itself is doing, right alongside your data.
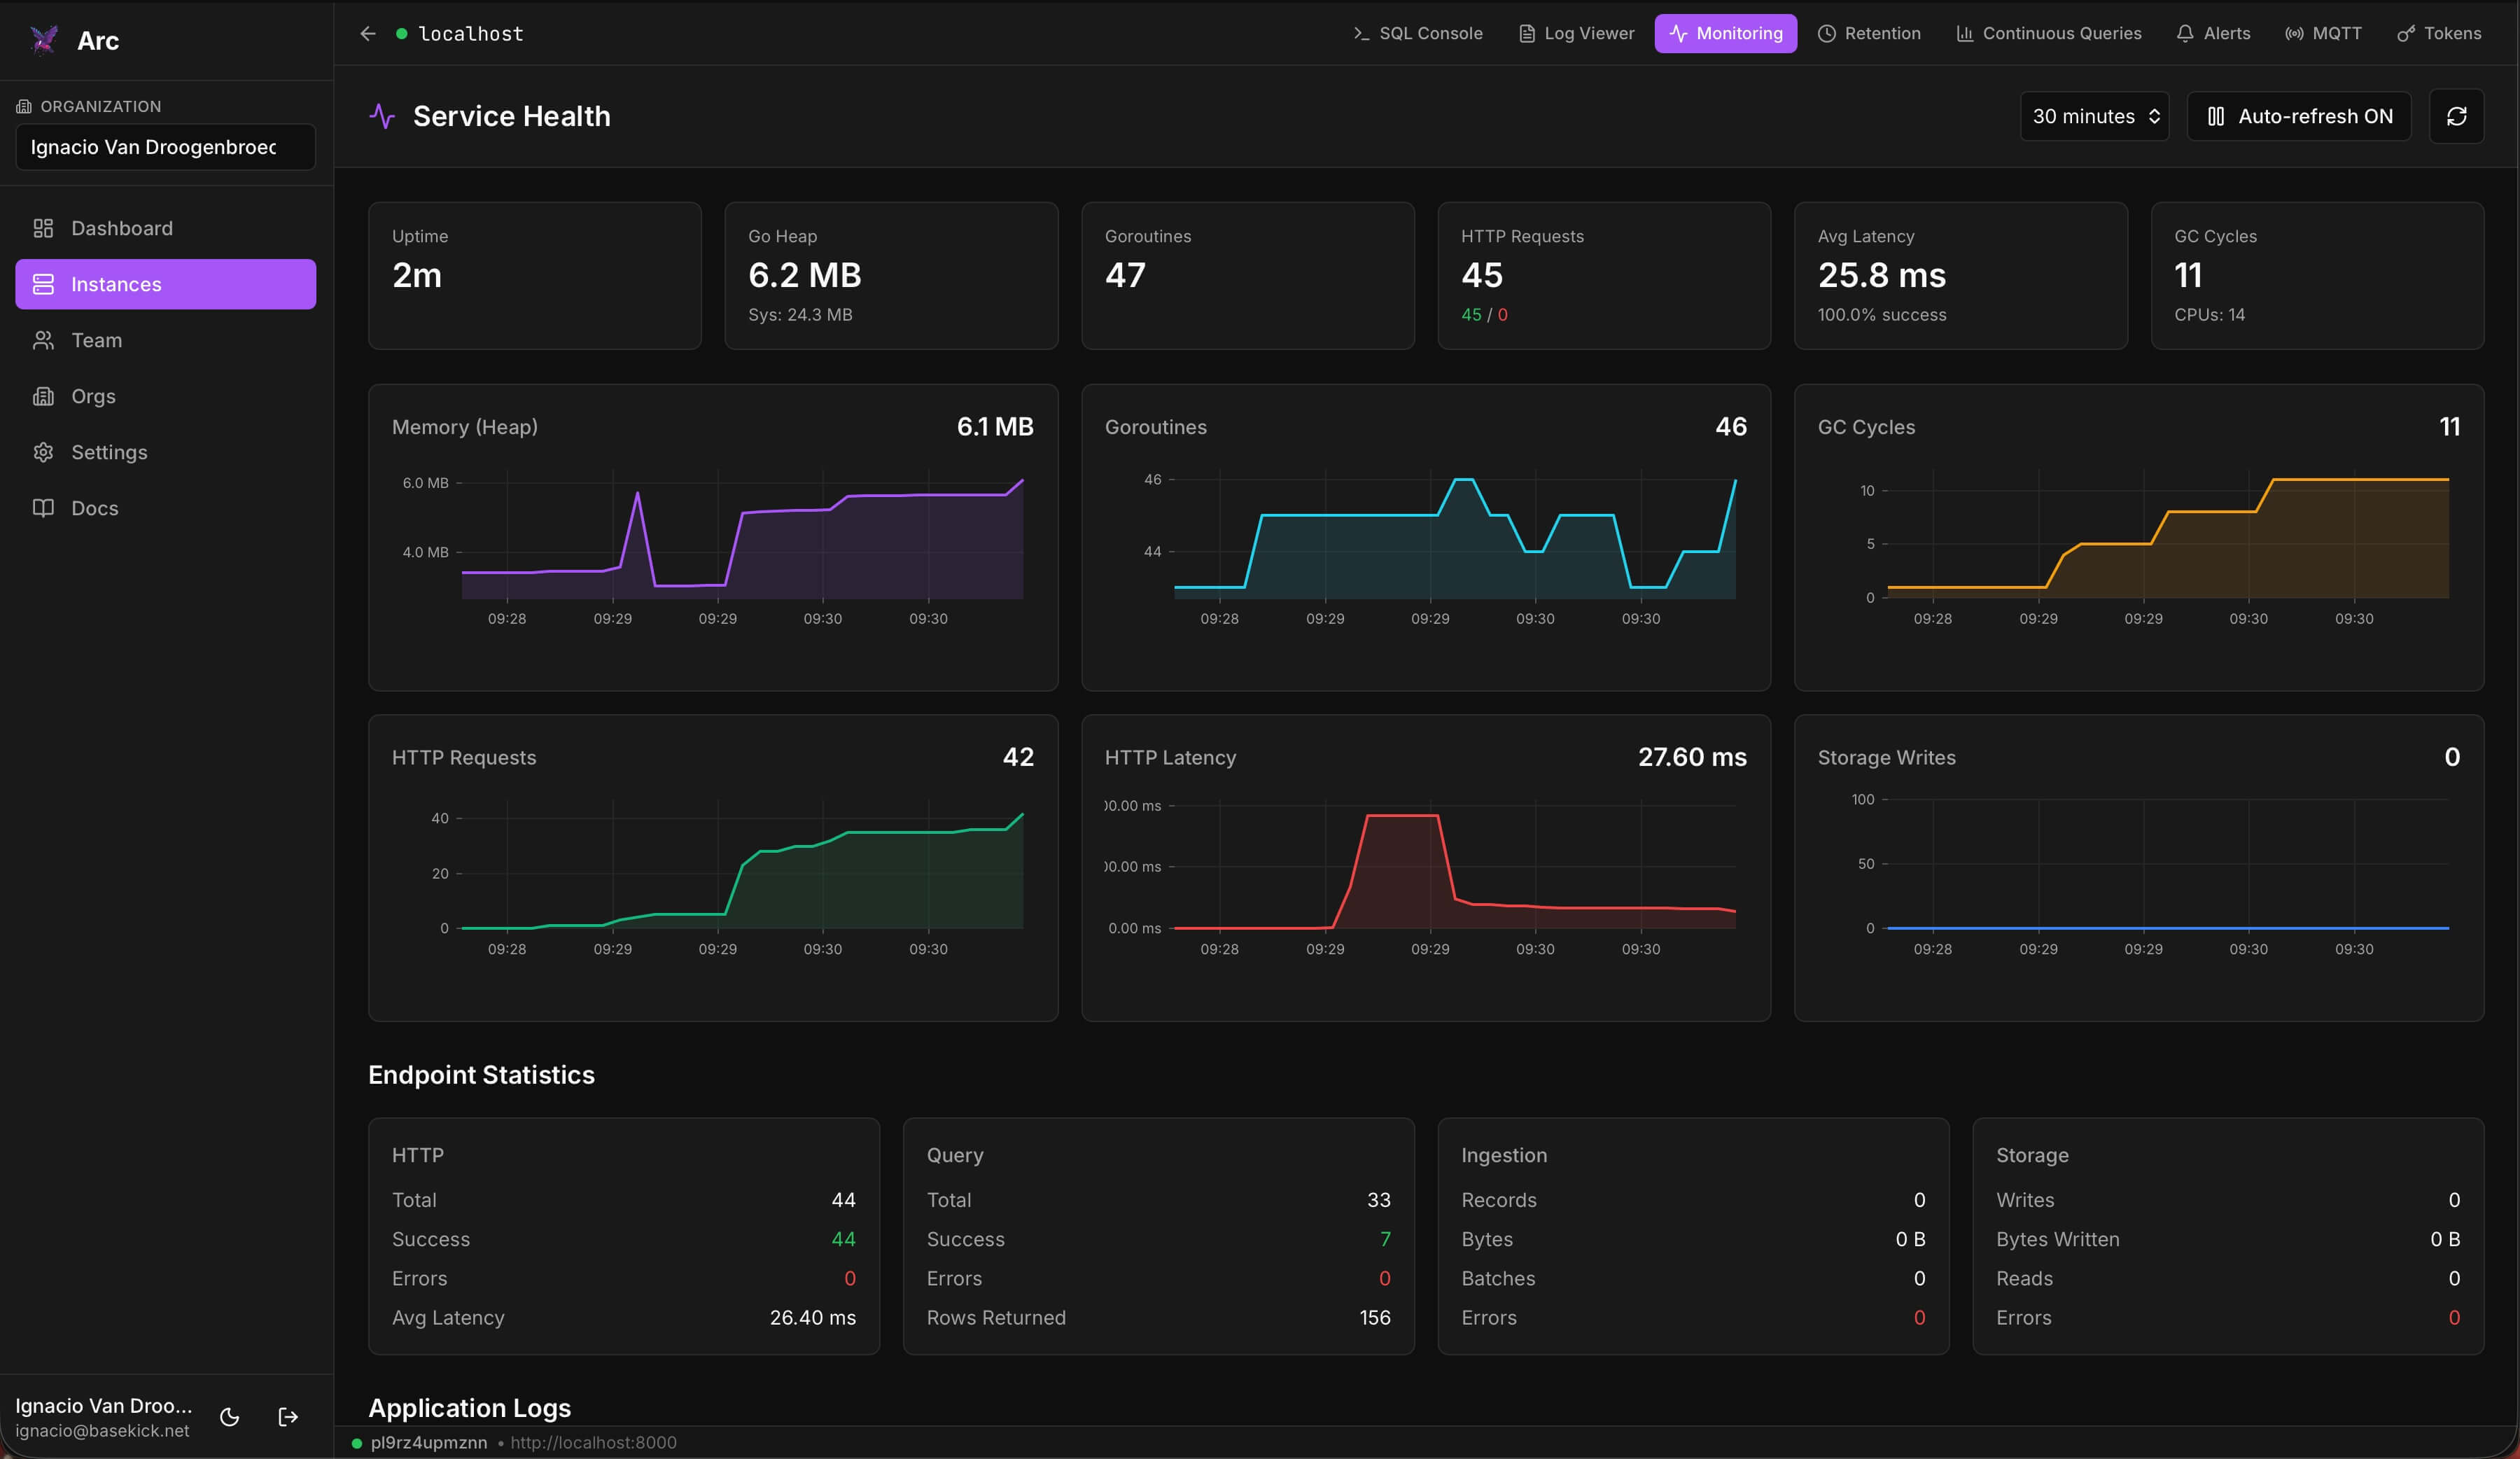
It shows the instance's operational signals: ingestion throughput, query activity, and internal metrics. Use it to answer "is Arc healthy and keeping up?" rather than "what's in my data?".
Which tab do I want?
- Log Viewer → the logs your systems write into Arc.
- Monitoring → how the Arc server is performing.
SQL console
Run SQL against a connected Arc instance from the browser: browse the schema tree, replay query history, run a selection or a whole script, and export results as CSV, JSON, Markdown, or a chart.
Retention policies
Create Arc retention policies from the Retention tab: scope them to a database or measurement, set retention and buffer periods, preview deletions with a dry-run, then execute or schedule them.